This RCGP Quick guide introduces Fishbone diagrams (also called cause and effect analysis) which are used to help to identify and display the root causes of a problem.
They are useful when there are multiple causes of a problem and help to ensure important potential factors are not ignored.
Download RCGP Quick guide: Fishbone diagram
How to
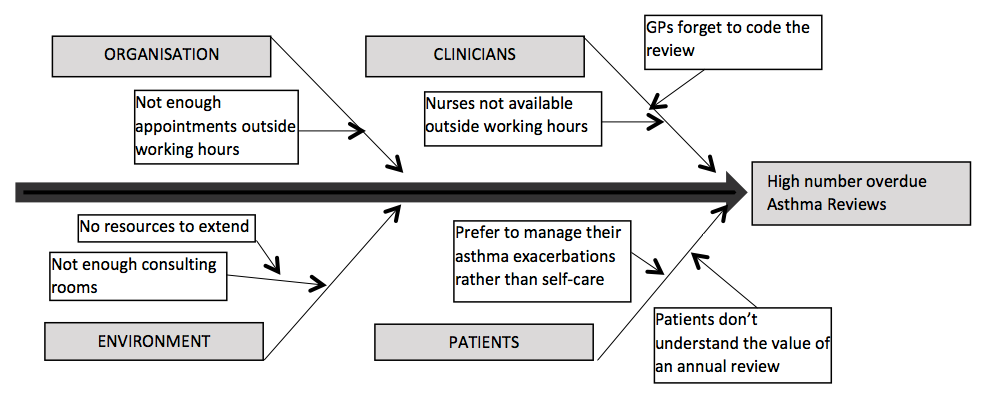
This example shows the use of a Fishbone diagram to understand why there are so many overdue Asthma reviews.
- Identify the problem. This becomes the head of the fish: High number overdue Asthma Reviews
- Gather the relevant people together and generate the major categories of potential causes. In the example shown these are Environment, Organisation, Clinicians and Patients. Other useful categories also include Equipment and Time. These form the spines of the fish.

- Discuss each major category, adding the ideas generated as sub-branches. Each sub-branch may be further broken down into its contributing factors.
- For every spine and sub-branch identified, ask yourself ‘Why does this happen?’ and consider the question from different perspectives – such as patient, administrator, nurse, doctor, clinical commissioning group. This will produce the layers of causes that will help you to fully understand the root of the problem and its dependencies.
- Use your completed Diagram to help you to generate ideas for improvement, which may then result in the development of a Driver Diagram to plan your improvements.