
Once a project is underway, monitoring the chart helps to ensure you stay ‘on track’ to meet the milestones you set yourself.
A Gantt chart provides a visual representation of your project schedule which helps to identify a realistic timeframe for implementing a project. You can focus on the next ‘to do’ that needs auctioning, a well as review progress towards milestones by using the tracker function that colour codes progress. Once a project is underway, the plan should be monitored and reviewed regularly.
Download RCGP Quick guide: Gantt Charts
How to
Consider:
- All the milestones to be achieved for the project.
- The tasks involved in delivering each milestone.
- Who will be responsible for each task.
- How long each will take.
- Any problems the team might encounter in implementing them.
- Which tasks are contingent on another.
It can be created on Excel by customising a stacked bar chart. In Excel 2013 a template can be downloaded free from Microsoft (Figure 1).
Figure 1: Gantt Chart
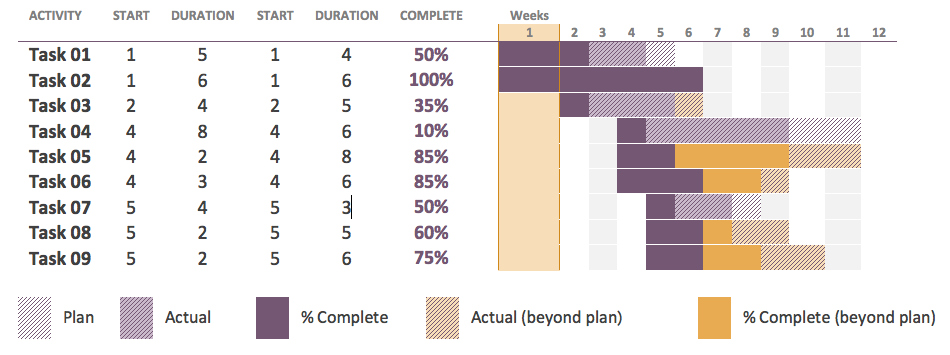
To create a Gantt Chart:
- List the milestones and constituent actions (tasks) on the vertical axis.
- List the time – in days, weeks or months – on the horizontal axis.
- For each task, identify the proposed start point and draw a horizontal line from that point to the point when the action is due to be completed.
